 .
.You can insert statistics about the length of the used rules. The statistics are listed in a table which is automatically updated each time the type and/or the length of the rules in the project change. You can insert a rules statistics table both in a design frame and a print drawing.
You define a rectangle into which EngView inserts the table. The table lists the used styles appears automatically, followed by the respective length of the rules.
To insert a rules statistics table
.A contextual edit bar appears.

The table appears, displaying the styles in the drawing, with their names and lengths.
The Print Legend Properties dialog box appears.
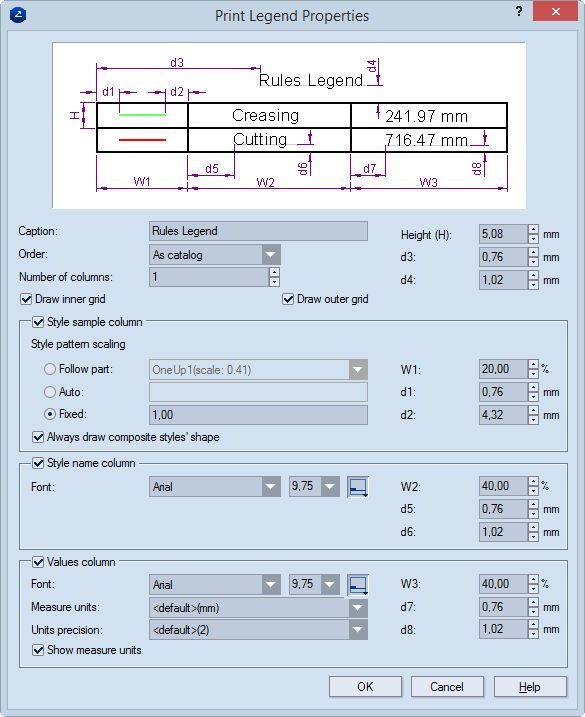
| Caption | The title of the table as it will appear in the print drawing |
|---|---|
| Order | In the dropdown list, choose how you want style names listed
in the legend table:
|
| Number of columns | Arranges the data in as many columns as specified. A column consists of the style's visual representation, its name, and the numerical value. |
| Draw inner grid | Shows the table's inner cell borders. |
| Draw outer grid | Shows the table's outer borders. |
| Height (H) | Sets the height of the table rows. |
| d3–d4 | Set the values for the d3 and d4 distances in the table. (See the image in the dialog box.) |
| Style sample column | Displays the column that visualizes the styles' patterns. If you do not select the check box, the column will not appear. |
| Style pattern scaling | Settings for how you want EngViewPrinect to scale style patterns
in the legend table
|
| Always draw composite styles shape | (Applies for displayed composite styles) When the check box is selected, you see the actual pattern of a composite style — that is, as the object in this style will be produced on the media. NOTE: This is defined in the Structure tab of the Global Styles dialog box). When the check box is empty, you see the style as a straight line — that is, as defined in the Visual tab of the Global Styles dialog box). |
| W1 | The width, in percentage of the length of the first column, of the section in which the visual representation of the style pattern will appear. |
| d1–d2 | Set the values for the d1 and d2 distances in the table. (See the image in the dialog box.) |
| Style name column | Displays the column that holds the styles' names. If you do not select the check box, the column will not appear. |
| Font | Sets the font in which the text of the style name will appear. |
| Text alignment | (Applies to Style name font and Values font) Sets the text's orientation. Click, and then drag downward. Then, from the positioning options that appear, select how you want the text aligned within its bounding rectangle. NOTE: You also have three horizontal alignments: left, central and right. The default icon shows the left alignment. For right alignment, the d5 and d7 distances will apply for the respective distances from the right cell border to the first symbol of the text. For centrally aligned texts, any values set for the d5 and d7 distances will be ignored. |
| W2 | Sets the width of the section in which the name of the style will appear. in percentage of the length of the second column. |
| d5–d6 | Set the values for the d5 and d6 distances in the table. (See the image in the dialog box.) |
| Values column | Displays the column that holds the styles' values. If you do not select the check box, the column will not appear. |
| Font | Sets the font in which digits will appear in the table. |
| Measure units | Sets the measurement units used for displaying the length of objects. |
| Units precision | Sets how many digits after the decimal point will be displayed for the numerical values. |
| Show measure units | Displays the measurement units. If the check box is empty, only the digits appear. |
| W3 | The width, in percentage of the length of the third column, of the section in which the name of the style will appear. |
| d7–d8 | Set distances for the values and symbols in the table. For the specific distance references, see the image in the dialog box. |