 , and then from the list that appears add the style that you need.
Every geometric object has a style which is global for the system and determines object properties, such as color, width and pattern of its constructional line or curve. Changing the style globally affects the respective properties of all objects for which it applies. However, you can set the style-conditioned properties of each object individually — for example, you can have two lines in the same style but appearing with different colors, line patterns, and so on, which override the default style settings.
IMPORTANT: The Object Properties dialog box serves various objects in different contexts. These tabs are object-specific and appear dynamically, depending on the object from which you invoke the dialog box.
To edit object properties
The Object Properties dialog box appears.

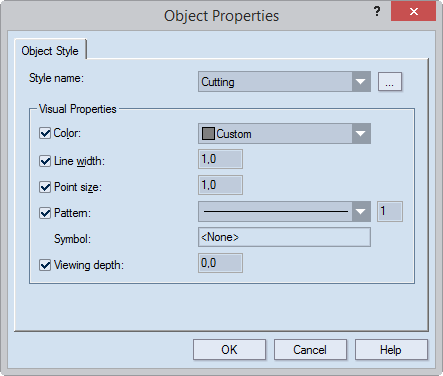
Style name Sets a style for the object. This list offers all available styles, including the user-created ones.
Visual Properties Properties that define what objects in the style selected in Style name will look like on the screen.
Color Sets the color for the object to which the style is assigned. By default, the color of the assigned style is set, but a different color may be set too.
Line width (in pixels) Sets how wide a constructional line or curve will be visualized on the screen. By default the globally set line width for the object style is set. The value applies only to the how objects are displayed on the screen in the 1up, layout, print, CAM and 3D drawings; it does not affect line width in printing jobs and in tool path generation in CAM samplemaking.
Point size (in pixels, discrete points only) Sets how big the object point is visible on the screen. By default, the globally set point size is assigned for the object style. Value range: [0.10, 15.00].
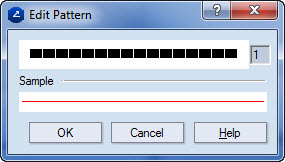
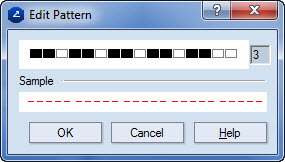
Pattern Sets the visual pattern of the constructional line or curve of the object. By default, the globally set line pattern is assigned for the object style. The dropdown list contains predefined patterns and an option (Custom...) for creating custom patterns. The numerical field (in pixels) sets the proportional scaling of the length of the pattern segments and the blank intervals between them. Greater values result in longer segments and intervals. Value range: [1, 10].
Symbol (read-only) The symbol used to designate the style when the drawing is printed out.
NOTE: Symbols are useful when legends are created in a printed drawing of the styles featured in the drawing — for example, tables that list the styles: Cutting in red; Creasing in green. The best practice is that each style should have its own symbol; this identifies it clearly in the drawing.
Viewing depth (screen only) Sets the stack order of a style. Value range: –1 to 1. If multiple objects in different styles overlap, the object in the style with the greatest stack order is visible on the screen and the others are not visible regardless of when each object was drawn. Example: If the Cutting style has a stack order of 0.5 and the Axis style has a stack order of -0.4, when objects in the two styles overlap, the one in the Cutting style is always be visible and that in the Axis style is always not visible.
This applies also to selections: For overlapping objects, the object in a style with a greater stack order is always visible even if the object in a style with a lower stack order is selected. If objects in styles with the same stack order overlap, you see the one that is selected.
 , and then from the list that appears add the style that you need.
The Edit Pattern dialog box appears. In Sample, the current color is displayed.


NOTE: As the coordinate axes cannot be selected and are not represented in the tabular area, to invoke the Object Properties dialog box for them, rest your pointer over an axis, right-click, and then click Object Properties on the context menu.
Notes